I. Data Exploration
As a response to the long-term economic effects of the COVID-19 pandemic, the U.S. government announced its first-ever, wide-ranging student debt relief plan. Following the first-of-its-kind announcement, an overwhelming number of conflicting narratives emerged.
Therefore, I decided to visualize higher education debt data to interpret it for myself and attempt to uncover who is affected by this debt relief. How many people qualify? How many people will have all federal loan debt relieved?
In this independent project, I use Tableau to visualize education debt and share my findings here.
II. Data Processing
Step 1 - Obtain Data:
First, I downloaded data from:
Step 2 - Data Integration:
While I will use available student loan data from 1982 to the present to showcase the increasing debt size over time, most data values will be from 2019, the last reported Student Loan data before the payment pause of April 2020. I saved the spreadsheets locally and leveraged Tableau’s Data Interpreter tool to link the correct data to their corresponding column name. Once the connection to the spreadsheets are made, I use Tableau logical table schema to reference most tables by their corresponding “Year” columns.
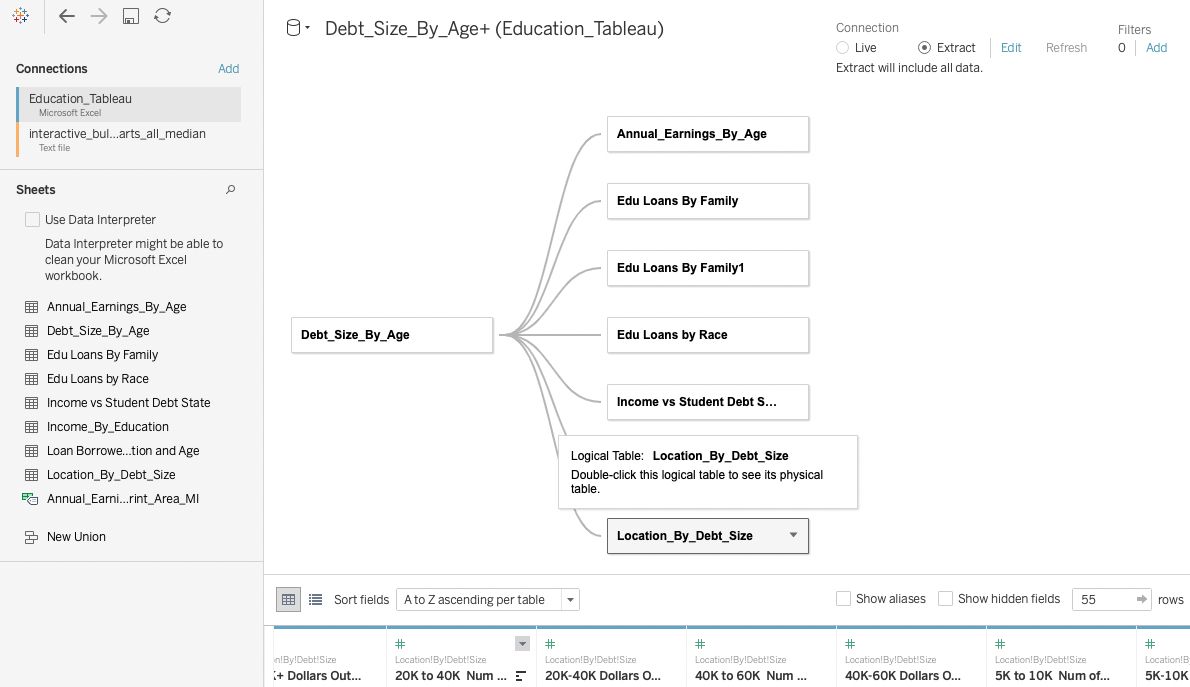 Tableau Connections
There are custom measures I wished to calculate, I use Tableau’s Calculated Field to create Total Debt under $20K and Median Income for Non-College degree holders
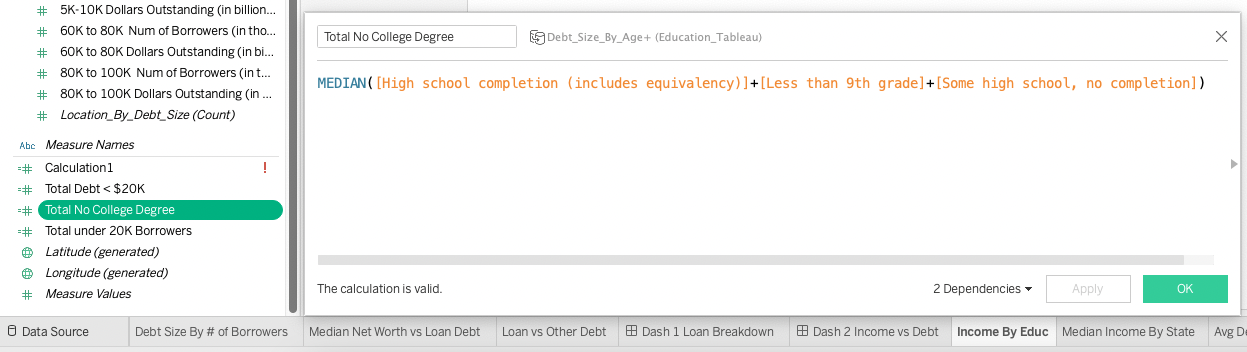 Tableau Measures
III. Visualization in Tableau
Step 3 - Data Visualization:
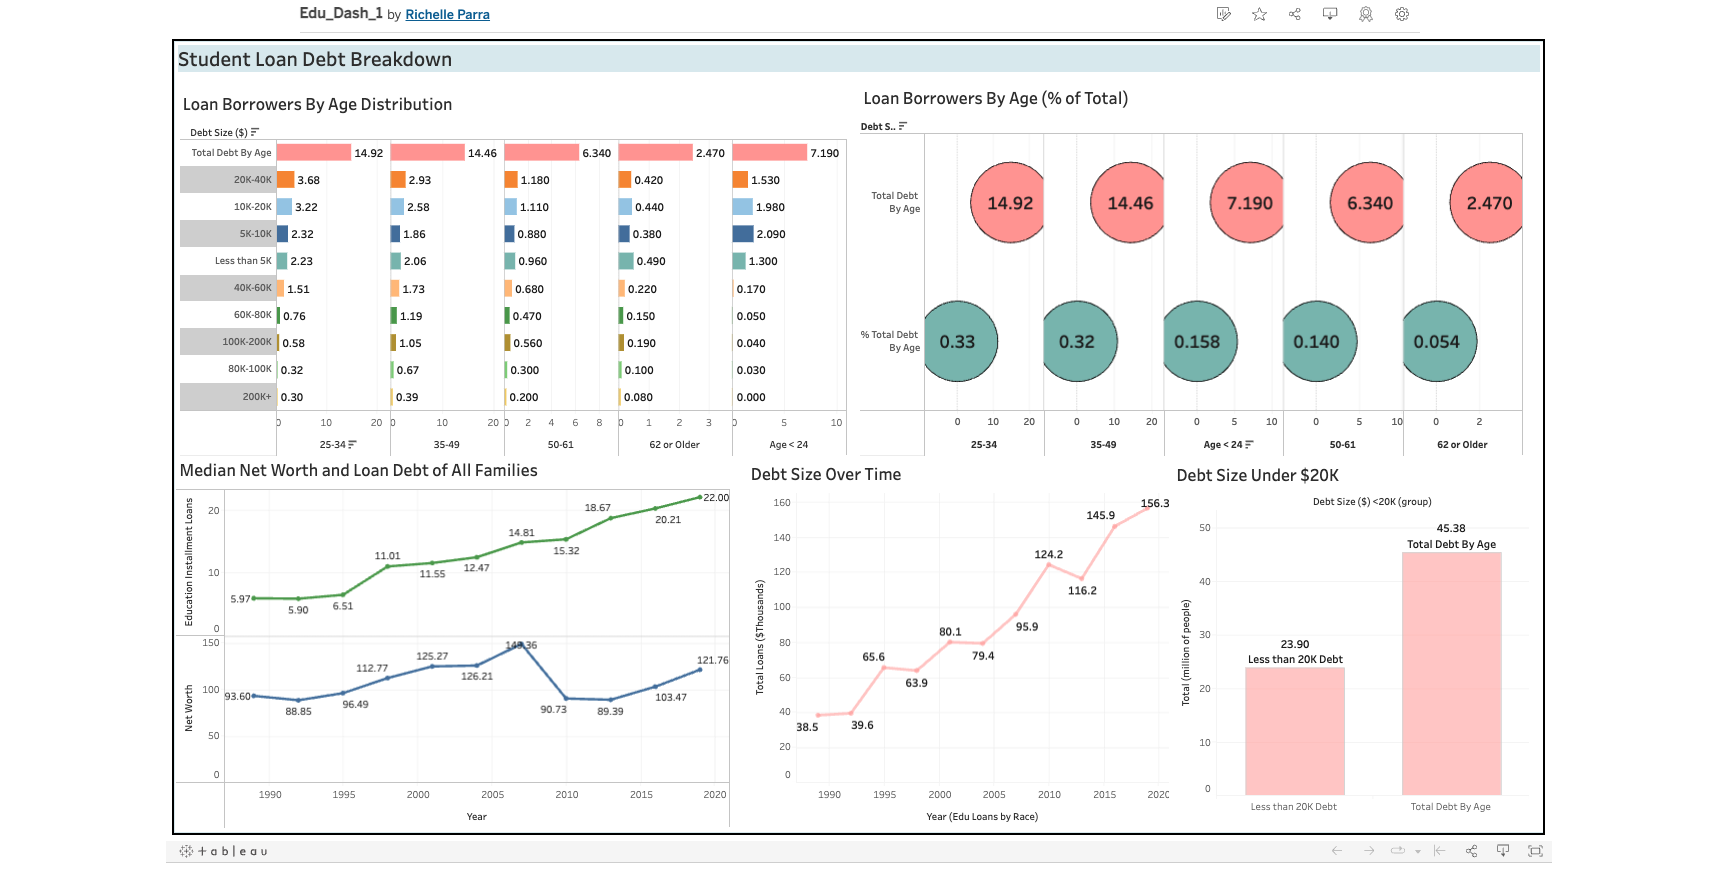
Dashboard 1 – Student Loan Breakdown
- Loan Borrowers By Age Distribution
- Loan Borrowers By Age (% of Total)
- Median Net Worth and Loan Debt of All Families
- Debt Size Over Time
- Debt Size Under $20K
 Dashboard 1 – Student Loan Breakdown
Click here for the interactive Tableau Dashboard
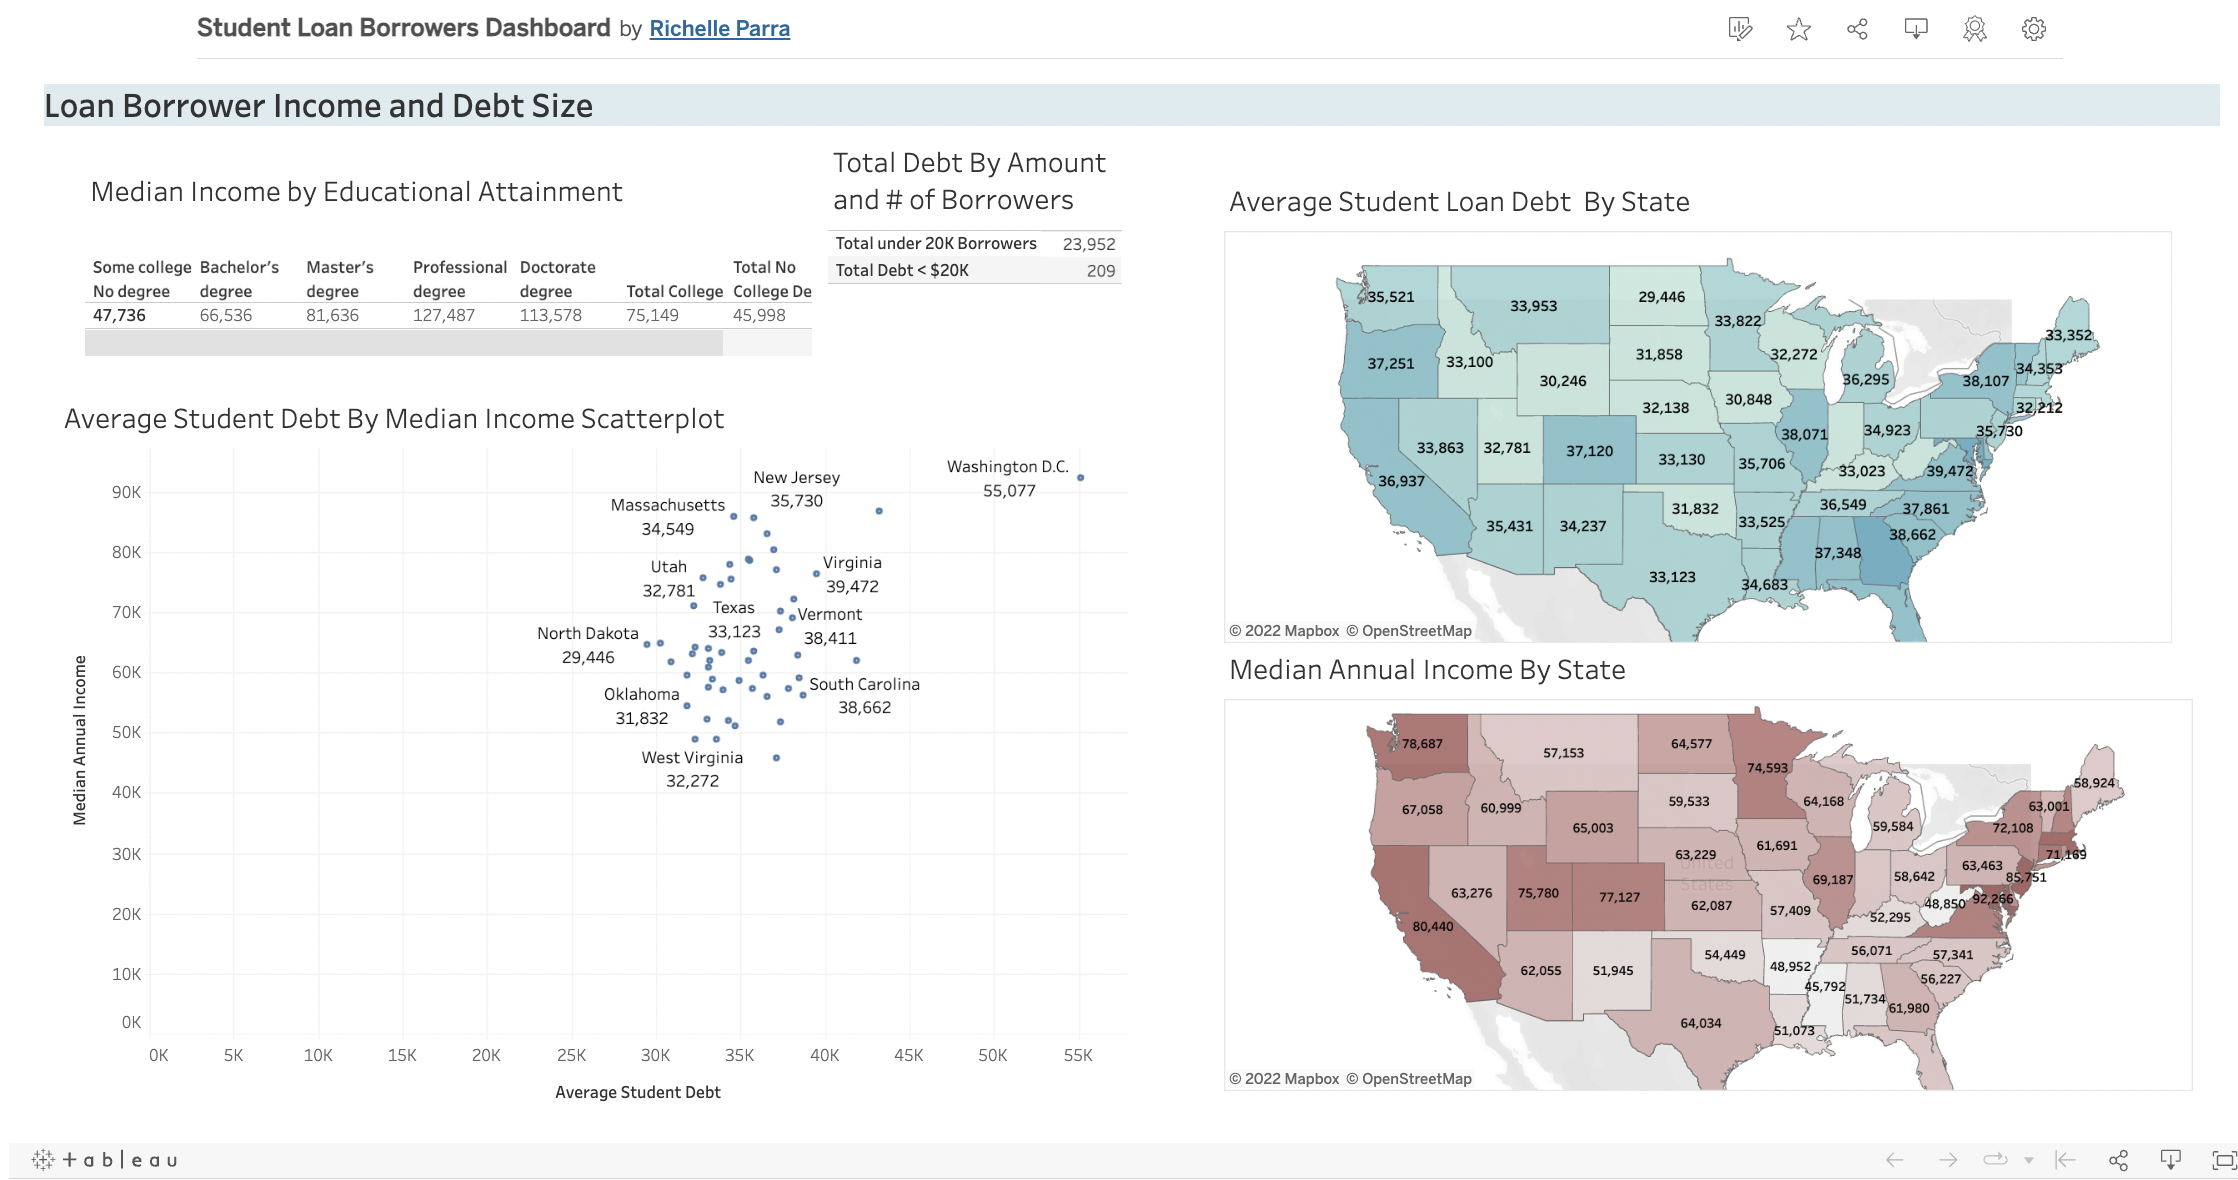
Dashboard 2 – Loan Borrower Income and Debt Size
- Median Income by Educational Attainment
- Total Debt By Amount and # of Borrowers
- Average Student Loan Debt By State
- Median Annual Income By State
- Average Student Debt By Median Income Scatterplot
 Dashboard 2 – Loan Borrower Income and Debt Size
Click here for the interactive Tableau Dashboard
IV. Summary Findings
Federal student loan debt breakdown
- Total federal student loan borrowers (2019): 45.4 million.
- Total outstanding federal student loan debt (2019): $1.6 trillion.
- 65% of education debt is held by 25 to 49-year-olds (31 million people) and 7.2 million people aged less than 24 owe 16% of student debt.
- About half or 24 million loan borrowers have $20K or less in education debt
- Education Installment debt has increased steadily regardless of economic landscape. Meanwhile, U.S. Families’ net worth dropped during the 2008 financial crisis and has not recovered to same level since.
Loan Borrower Income and Debt Size
Median income (self-reported):
- without a college degree is $46K
- with a college degree is $75K
- Bachelor’s: $66K
- Master’s: $82K
- Doctorate: $113K
- Some college but no degree is $48K
Loan Borrowers Average Debt and Median Income^
Highest average debt:
- Washington DC: $55K - Maryland: $43K - Georgia: $42K
Lowest average debt:
- North Dakota: $29K - Wyoming: $30K - Iowa: $31K
Highest Median income:
- Washington, DC: $92K - Maryland: $87K - Massachusetts: $86K
Lowest median income:
- Mississippi: $46K - West Virginia: $49K - Arkansas: $49K
^Education Data Initiative, non-government source, calculated median income by average student debt
Conclusions from Tableau Visualizations
Who is affected by this debt relief?
45.4 million federal loan borrowers with outstanding debt.
How many people qualify?
If we apply the current official estimate of 60%, then 27.3 million borrowers will receive up to $20K in debt relief.
How many people will have all federal loan debt relieved?
Half of loan borrowers have $20K or less in outstanding debt. However, exact number is unknown given Income and Pell grant requirements. If we apply the current official estimate of 60%, then 14.4 million borrowers qualify to have up to $10K in debt relief if they did not receive a Pell grant and up to $20K if they did.
The most challenging information to obtain was income data for education loan borrowers. Avg Student Debt data vs Median Income does not indicate how many of those people have incomes below $125K (single filing) or under $250K (joint filing) nor which percentage of them ever received Pell grants. The Biden administration claims 60% of total borrowers will qualify for up to $20K in debt relief. It is safe to conclude that until the Dept. of Education releases official debt relief data, how many people will receive debt relief are informed estimations.
In my view, the Average Student Debt By Median Income Scatterplot is the most telling visualization. While median income ranges from $33K to $86K by state, the student debt range is much narrower $29K to $43K. This means the impact of up to $20K debt relief will be more meaningful to borrower's discretionary income in lower median income states.